Upload date
All time
Last hour
Today
This week
This month
This year
Type
All
Video
Channel
Playlist
Movie
Duration
Short (< 4 minutes)
Medium (4-20 minutes)
Long (> 20 minutes)
Sort by
Relevance
Rating
View count
Features
HD
Subtitles/CC
Creative Commons
3D
Live
4K
360°
VR180
HDR
54,452 results
Visualization and "audibilization" of the LSD Radix Sort algorithm. Sorts a random shuffle of the integers [1100] using least ...
459,316 views
13 years ago
Visit our channel Discord: https://discord.gg/thestudio Shout-out to Control for this idea :P Check out the NEW home for ArrayV ...
3,109,265 views
4 years ago
Illustration of how a neural net with one hidden layer can approximate a function. Wikipedia: ...
29,063 views
Hello, My name is Mr. Nobody. Today's video is an experiment for visualizing arrays using Manim. # Tools ...
714 views
Visualization and "audibilization" of the Quick Sort algorithm. Sorts a random shuffle of the integers [1100] using the original ...
348,019 views
Visualization and "audibilization" of the Merge Sort algorithm. Sorts a random shuffle of the integers [1100] using merge sort.
294,792 views
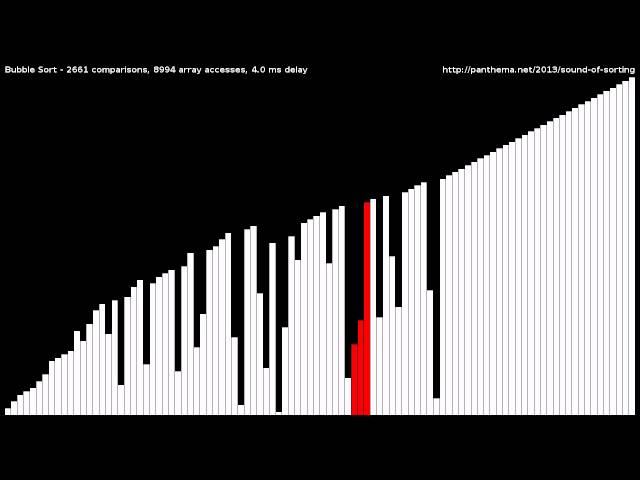
Visualization and "audibilization" of the Bubble Sort algorithm. Sorts a random shuffle of the integers [1100] using bubble sort.
445,416 views
Visualization and "audibilization" of the TimSort algorithm. Sorts a random shuffle of the integers [1100] using TimSort (standard ...
239,753 views
12 years ago
Visualization shows how K means++ selects the initial points (for k=4) For more info check Updated ...
13,330 views
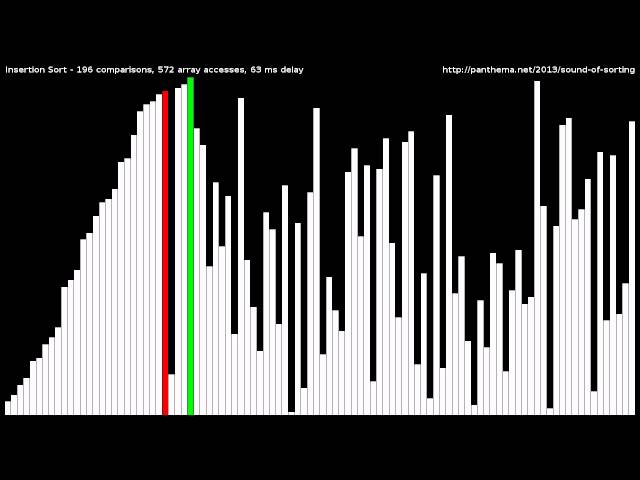
Visualization and "audibilization" of the Insertion Sort algorithm. Sorts a random shuffle of the integers [1100] using right to left ...
355,896 views
Visualization and "audibilization" of the Cocktail Shaker Sort algorithm. Sorts a random shuffle of the integers [1100] using cocktail ...
118,371 views
Visualization and "audibilization" of Shell's Sort algorithm. Sorts a random shuffle of the integers [1100] using Shell's sort with ...
134,813 views
Visualization and "audibilization" of the Comb Sort algorithm. Sorts a random shuffle of the integers [1100] using comb sort ...
95,310 views
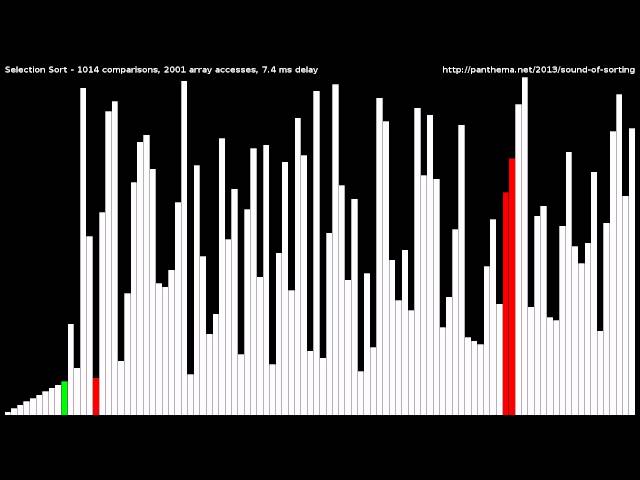
Visualization and "audibilization" of the Selection Sort algorithm. Sorts a random shuffle of the integers [1100] using left to right ...
213,006 views
341 views
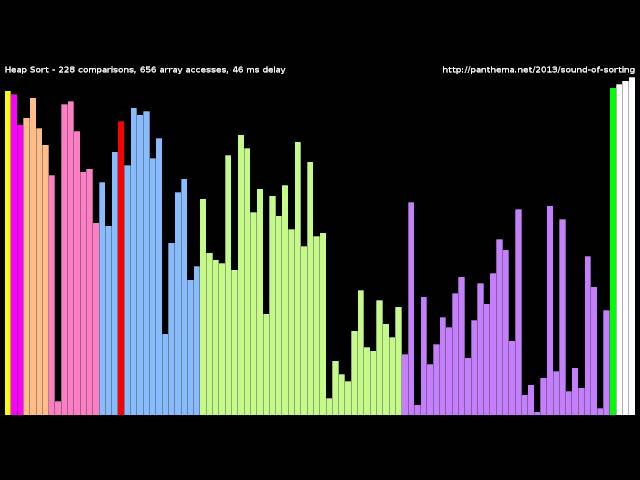
Visualization and "audibilization" of the Heap Sort algorithm. Sorts a random shuffle of the integers [1100] using max-heap sort.
246,337 views
Visualization and "audibilization" of the MSD Radix Sort algorithm. Sorts a random shuffle of the integers [1100] using most ...
124,523 views
Visualizing algorithms par Pierre et Samya Data Scientist, just like their ancestors, Statisticians and Computer Scientists work on ...
489 views
7 years ago
359 views
5 years ago